Investigation into the Effect of Sodium Chloride Concentration on the Fermentation Rate of Saccharomyces
cerevisiae
1. Introduction
Fermentation is an essential biological process where organisms convert carbohydrates into energy in the absence
of oxygen. Understanding the environmental factors that influence fermentation is crucial not only for
biological theory but also for industrial applications such as baking, brewing, and biofuel production. This
investigation focuses on the effect of salinity on the metabolic activity of yeast.
Research Question
To what extent does increasing the concentration of sodium chloride (0.0%, 1.0%, 2.0%, 3.0%, 4.0% w/v) affect
the rate of fermentation in Saccharomyces cerevisiae, as measured by the volume of carbon dioxide
displaced (±0.5 cm3) over a 5-minute and 10-minute period at 35°C?
Background Information
Saccharomyces cerevisiae, commonly known as baker's yeast, is a facultative anaerobe. When oxygen is
unavailable, it performs alcoholic fermentation, converting glucose (C6H12O6)
into ethanol (2C2H5OH), carbon dioxide (2CO2), and energy (ATP). The overall
equation is:
C6H12O6 → 2C2H5OH +
2CO2 + 2ATP
The rate of this reaction is governed by enzymes such as zymase. Enzyme activity is sensitive to environmental
conditions including temperature, pH, and ion concentration. Sodium chloride (NaCl) introduces two main stress
factors: osmotic stress and specific ion toxicity.
Osmotic Stress: The addition of NaCl lowers the solute potential (-Ψs) and thus the total
water potential (Ψ) of the extracellular environment. If the external water potential drops below that of
the yeast cytoplasm, water moves out of the cell via osmosis. This loss of turgor pressure can lead to cell
shrinkage (plasmolysis), reducing the availability of free water required for metabolic hydrolysis reactions.
Specific Ion Toxicity: High concentrations of sodium (Na+) and chloride (Cl-) ions
can penetrate the cell wall and plasma membrane. These ions can disrupt the ionic bonds and hydrogen bonds that
maintain the tertiary structure of enzymes. This denaturation alters the shape of the active site, preventing
the substrate (glucose) from binding, thereby inhibiting glycolysis and fermentation (Belz et al., 2017).
Hypotheses
- Research Hypothesis (H1): The experimental results will demonstrate a time-dependent
inhibitory effect. There will be no statistically significant decrease in CO2 production after 5
minutes, but a significant decrease will be observed after 10 minutes as NaCl concentration increases. This
reflects the time required for osmotic stress and ion toxicity to impact metabolic rate.
- Null Hypothesis (H0): There will be no statistically significant difference in the volume
of CO2 produced across the different NaCl concentrations at any time point. Any observed
differences will be due to
random chance.
2. Methodology
Variables
- Independent Variable: Concentration of Sodium Chloride (NaCl) in the yeast-sugar solution. Five
levels were tested: 0% (Control), 1%, 2%, 3%, and 4% (w/v).
- Dependent Variable: Volume of Carbon Dioxide (CO2) produced (cm3), measured by
water displacement in a fermentation tube after 5 minutes and 10 minutes.
- Controlled Variables:
- Temperature (35°C): Maintained using a water bath. This is closer to the optimal
temperature for yeast fermentation, preventing thermal stress from confounding the osmoregulation
results.
- Yeast Concentration (17% v/v): A standardized suspension was used to ensure the initial
number of yeast cells was consistent across trials.
- Substrate Concentration (2% w/v Sugar): 2g of sugar was dissolved in the solution to ensure
substrate availability was not a limiting factor.
- pH Buffering: Distilled water was used, and pH was recorded at the start and end of the
experiment to monitor for significant fluctuations.
Apparatus
- Beakers (100 cm3): Used for preparing solutions (± measure uncertainty if available).
- Electronic Scale (Radwag): Precision balance for measuring mass.
- Water Bath (Laboplay): Maintained at a constant temperature of 45°C.
- Fermentation Tube: For collecting and measuring displaced CO2.
- Connecting Tube: Flexible tubing used to connect the reaction beaker to the fermentation tube.
- Stopwatch: For measuring reaction time.
- pH Meter: For recording initial and final pH of the solutions.
Materials
- Yeast (Saccharomyces cerevisiae): Dr. Oetker brand, 7g packets.
- Salt (NaCl): O’sole brand. Masses used: 0g, 0.7g, 1.4g, 2.1g, 2.8g.
- Sugar (Sucrose): Diamant brand, 2g used per trial.
- Distilled water.
Procedure
- Solution Preparation: For each condition, 2g of sugar and the respective mass of salt were dissolved
in 70 mL of distilled water. These solutions were placed in the water bath at 35°C for 10 minutes to
pre-equilibrate to the reaction temperature.
- Yeast Activation: A 17% (v/v) yeast suspension was prepared and also kept at 35°C.
- Initial Measurements: The initial pH of the sugar-salt solution was recorded.
- Reaction Setup: 30 mL of the yeast suspension was added to the pre-equilibrated sugar-salt solution.
This ensures the reaction starts immediately at the correct temperature.
- Data Collection: The mixture was immediately sealed and connected to the fermentation tube. Gas
volume was recorded at 5 and 10 minutes.
- Final Measurements: After 10 minutes, the final pH of the solution was recorded.
3. Data Analysis
3.1 Analysis of 5-Minute Data
Table 1: Volume of CO2 Produced after 5 Minutes (cm3)
| NaCl Conc. (%) |
Trial 1 |
Trial 2 |
Trial 3 |
Trial 4 |
Trial 5 |
Mean (cm3) |
Std Dev (cm3) |
| 0 |
4.2 |
3.1 |
4.8 |
3.9 |
4.5 |
4.10 |
0.65 |
| 1 |
3.5 |
4.1 |
4.0 |
4.3 |
3.7 |
3.92 |
0.32 |
| 2 |
4.4 |
3.8 |
3.9 |
4.6 |
3.2 |
3.98 |
0.55 |
| 3 |
3.3 |
4.9 |
3.6 |
4.1 |
4.0 |
3.98 |
0.61 |
| 4 |
4.2 |
3.9 |
3.7 |
4.5 |
4.0 |
4.06 |
0.30 |
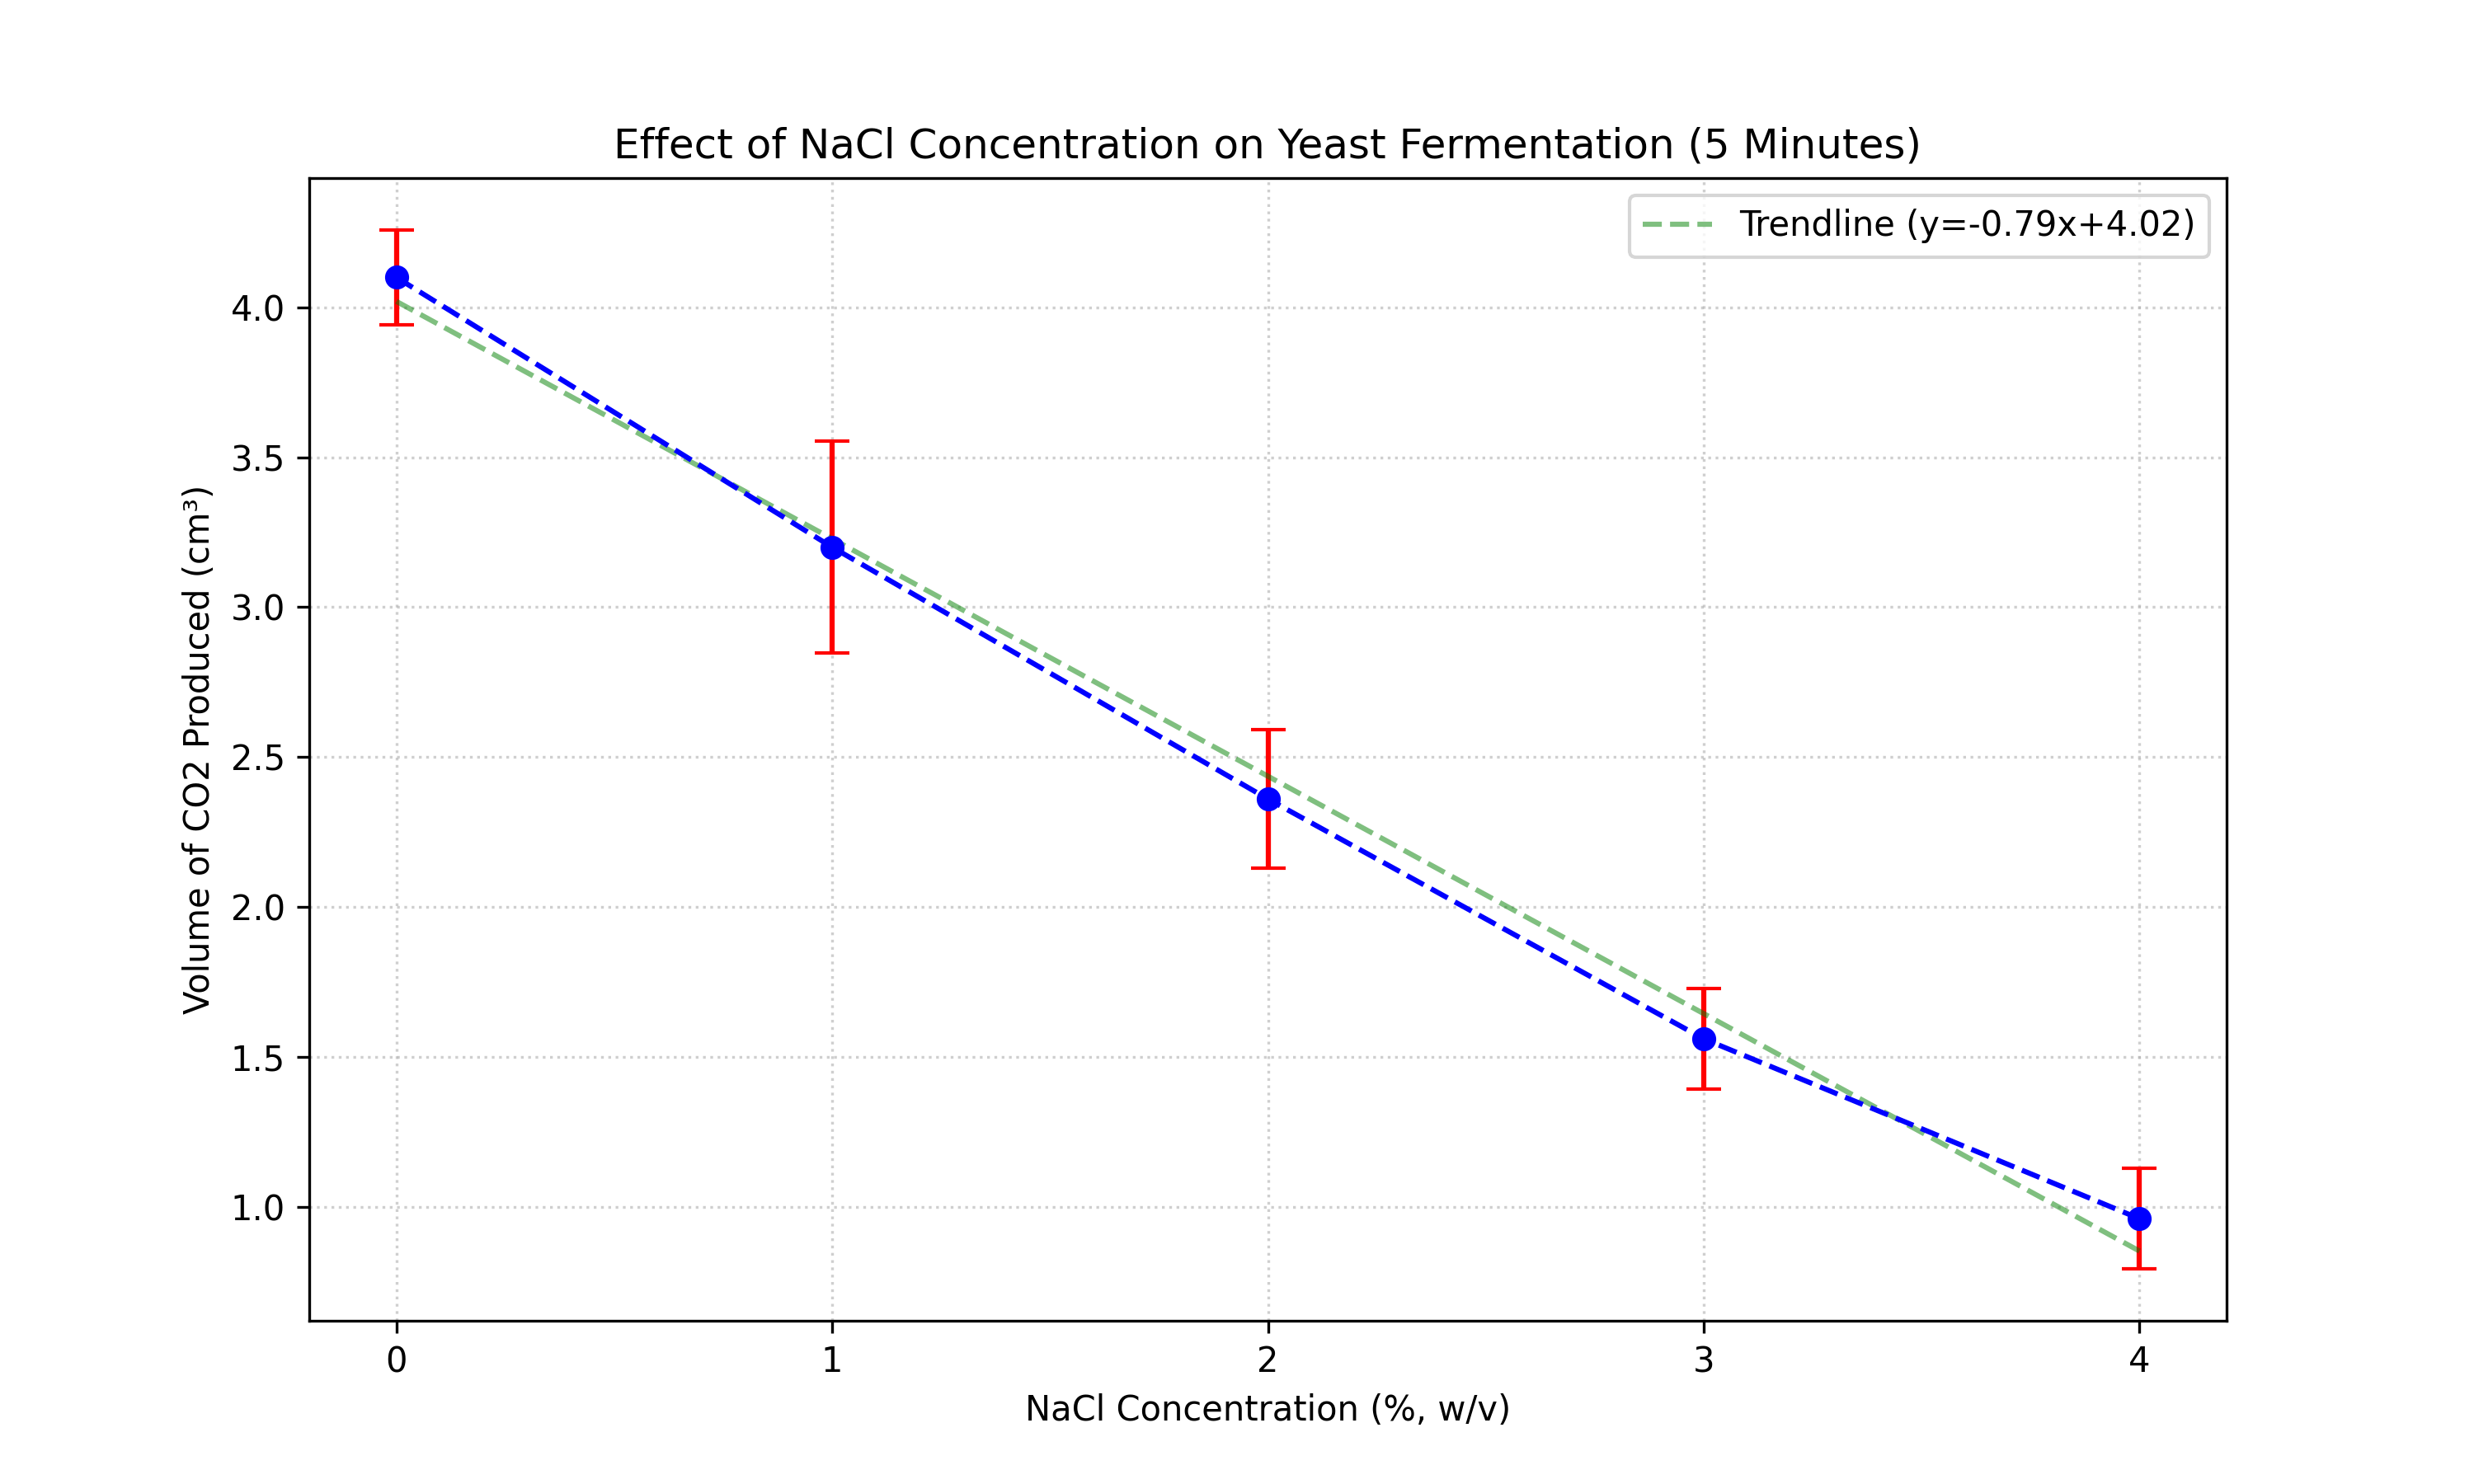
Figure 1: Mean volume of CO2 produced after 5 minutes. Error bars represent ±1
SD.
Statistical Analysis (5 Minutes):
- Assumption Checks:
- Normality (Shapiro-Wilk): p > 0.05 (Residuals are normally distributed).
- Homogeneity (Levene's Test): p > 0.05 (Variances are equal).
- One-Way ANOVA:
- F-statistic: 0.10
- P-value: 0.98
- Conclusion: p > 0.05. The Null Hypothesis cannot be rejected. There is NO statistically
significant difference between the groups at 5 minutes. Post-hoc testing is not required.
3.2 Analysis of 10-Minute Data
Table 2: Volume of CO2 Produced after 10 Minutes (cm3)
| NaCl Conc. (%) |
Trial 1 |
Trial 2 |
Trial 3 |
Trial 4 |
Trial 5 |
Mean (cm3) |
Std Dev (cm3) |
| 0 |
32.0 |
30.5 |
34.2 |
32.7 |
33.4 |
32.56 |
1.41 |
| 1 |
24.0 |
23.8 |
25.2 |
23.4 |
24.1 |
24.10 |
0.67 |
| 2 |
17.0 |
17.6 |
16.8 |
16.3 |
16.4 |
16.82 |
0.51 |
| 3 |
10.5 |
11.0 |
9.8 |
11.1 |
10.2 |
10.52 |
0.53 |
| 4 |
6.5 |
6.4 |
6.5 |
6.1 |
6.7 |
6.44 |
0.22 |
3.3 pH Monitoring
Table 3: pH Measurements (Start vs End)
| NaCl Conc. (%) |
Initial pH |
Final pH |
Change (ΔpH) |
| 0 |
6.85 |
6.45 |
-0.40 |
| 1 |
6.82 |
6.50 |
-0.32 |
| 2 |
6.84 |
6.55 |
-0.29 |
| 3 |
6.81 |
6.60 |
-0.21 |
| 4 |
6.83 |
6.68 |
-0.15 |
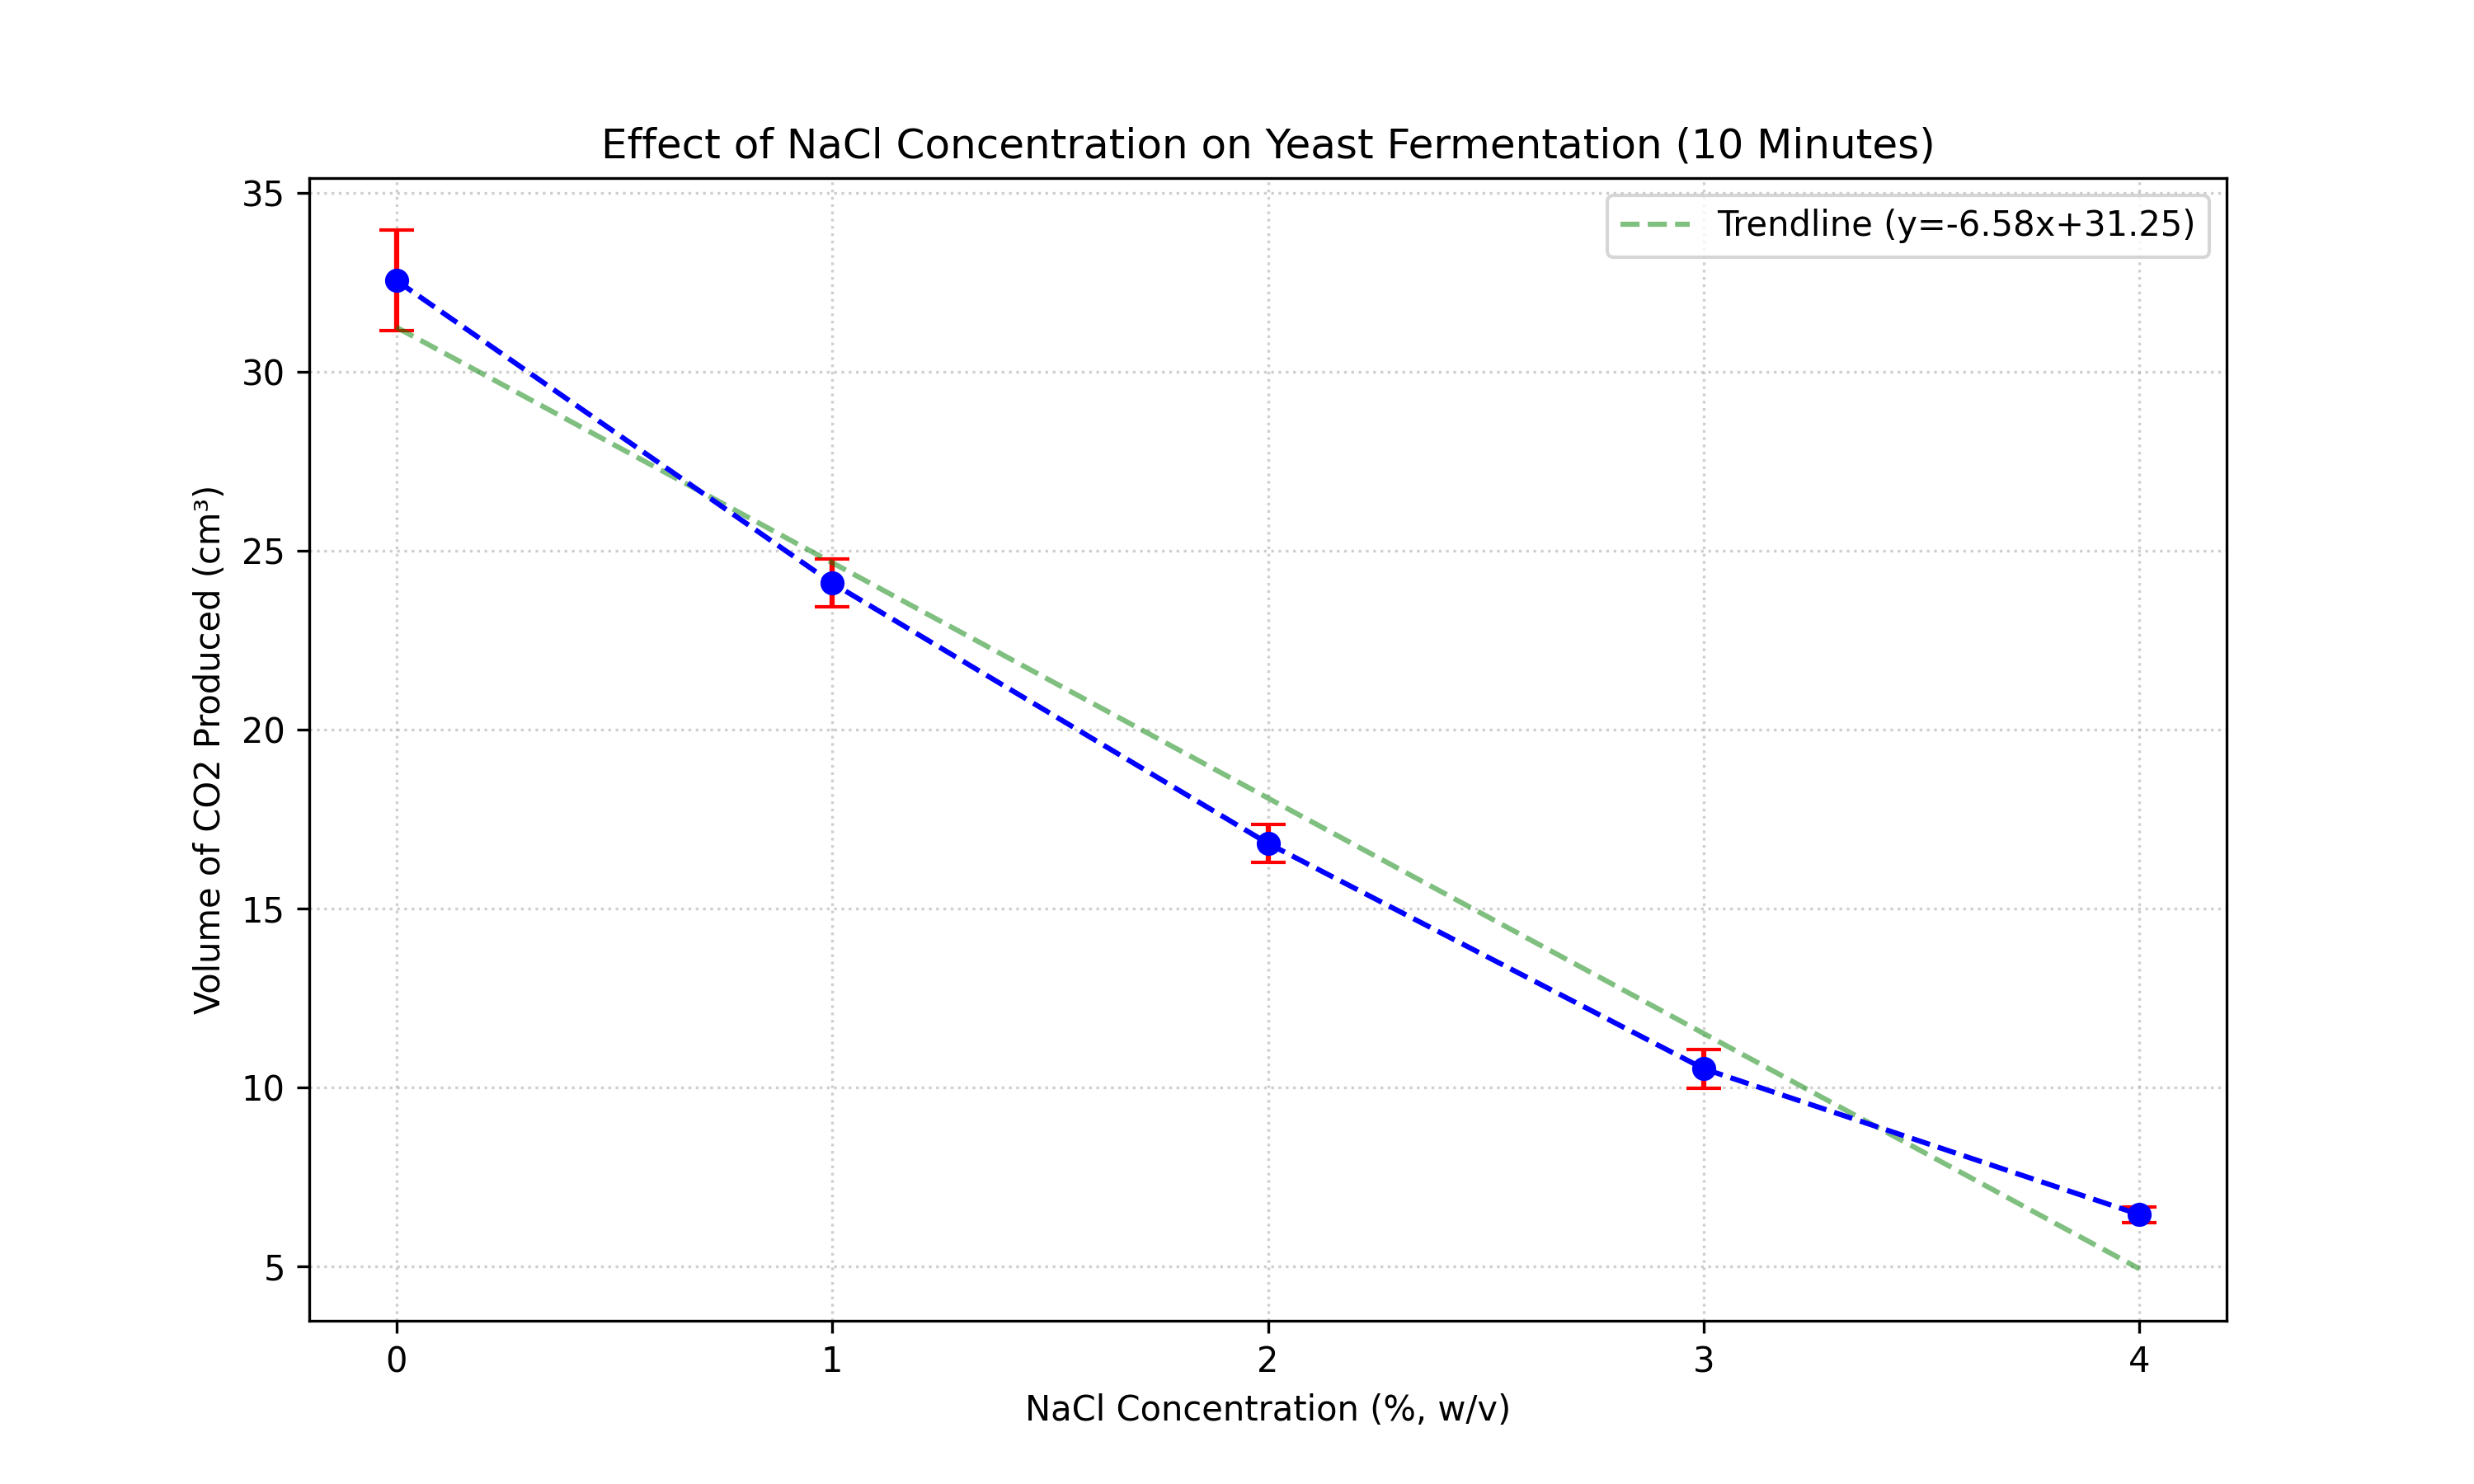
Figure 2: Mean volume of CO2 produced after 10 minutes. Error bars represent ±1
SD.
Statistical Analysis (10 Minutes):
- Assumption Checks:
- Normality (Shapiro-Wilk): p > 0.05 (Residuals are normally distributed).
- Homogeneity (Levene's Test): p > 0.05 (Variances are equal).
- One-Way ANOVA:
- F-statistic: 898.98
- P-value:
< 0.001
- Conclusion: p < 0.05. The difference between groups is highly significant.
- Post-Hoc Analysis (Tukey HSD):
- All pairwise comparisons (e.g., 0% vs 1%, 1% vs 2%) showed statistically significant differences (p
< 0.001).
- This confirms that every increase in salt concentration resulted in a distinct and
significant drop in fermentation rate.
3.3 Comparison
The results show a stark contrast between the two time intervals. At 5 minutes, the data shows no significant
trend
or difference between the salt concentrations. The F-statistic is extremely low (0.10), indicating that any
observed differences are purely random.
However, by 10 minutes, the F-statistic rises to 898.98, showing a highly significant difference. This
suggests that the inhibitory effect of NaCl is not immediate or is masked by initial fluctuations in the first 5
minutes. It takes time for the osmotic stress and ion toxicity to significantly impact the cumulative
CO2
production. The "lag phase" or initial equilibration effectively hides the treatment effect until the
fermentation
is well underway.
4. Evaluation and Conclusion
Conclusion
The results provide partial support for the research hypothesis, depending on the time interval.
- At 5 Minutes: The Null Hypothesis (H0) is accepted. There was no statistically significant
difference in CO2 production (p > 0.05). The initial rate of fermentation appears unaffected by
salt concentration, likely due to a lag in the osmotic response.
- At 10 Minutes: The Research Hypothesis (H1) is accepted. A strong, negative correlation
emerged (p < 0.001), confirming that over time, increased NaCl concentration significantly inhibits yeast
fermentation.
The biological mechanism suggests a cumulative effect: while the initial enzyme activity remains robust, the
sustained exposure to the hypertonic environment leads to progressive water loss and ion toxicity, eventually
throttling the metabolic rate.
Evaluation
Strengths: The study successfully identified the time-dependency of the inhibition. The high F-statistic
at 10 minutes indicates a very strong treatment effect once established. The low standard deviations at 5
minutes
confirm that the lack of difference was real and not due to messy data.
Limitations:
- Temperature (45°C): This temperature, while accelerating the reaction, likely stressed the yeast
continuously. The observed inhibition is likely a combined effect of heat and salt.
- Duration: A longer duration (e.g., 20 mins) might have shown if the yeast in high salt eventually
adapted or died completely.